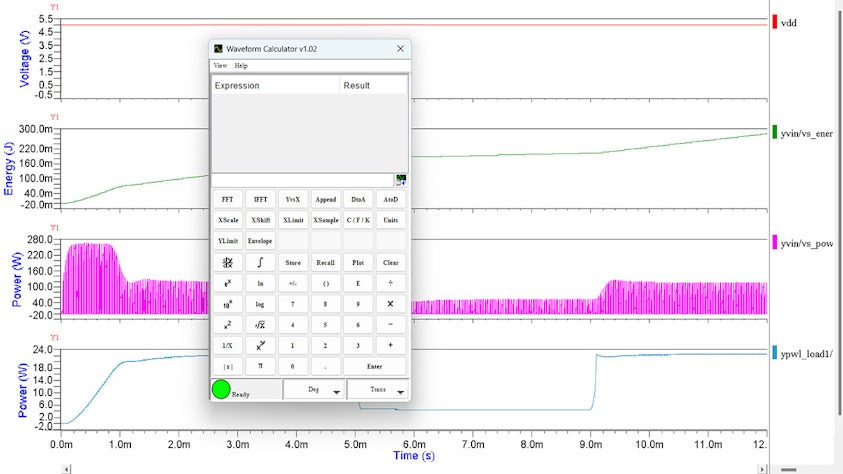
HyperLynx AMS includes a high-performance waveform database for manipulating huge waveform files and is capable of loading gigabytes of data in seconds. It can display both analog and digital signals against a common timebase and can perform mathematical operations on waveforms. It can display time or frequency domain data of any type: analog, digital, eye diagram, smith chart, polar or complex chart, and histogram.
Key features include:
- Intuitive Waveform Viewing: Load, display, search, and view multiple databases in a single session.
- Parametric Analysis: Easily manage results from multiple simulation runs.
- Graphical Waveform Calculation: Feature-rich environment for simulation results viewing and post-processing.
- Cursors and Measurement Tools: Perform and plot a variety of analog and mixed-signal measurement operations on waveforms.
- Waveform Post-Processing: Access advanced signal processing tools, charting, and analysis.
- Powerful Mixed-Signal Waveform Comparison: Automatically compare simulation results to a known-good waveform.
- Automatic Reloading: Automatically display and compare new simulation results with previous results during simulation.
- Scripting for more Automation: Run measurements in TCL using hundreds of built-in functions.


