Debug & Functional Coverage
Debug is one of the most important verification technologies and is critical for achieving productivity in today's complex designs. Companies need debug tools that provide maximum performance, capacity and automation for the complete system-on-chip design and verification cycle.
Critical Challenges in Debug and Coverage
More complex designs that include more software create new requirements for block-to-system verification reuse and the need for system verification and debug. To avoid wasting cycles at the system level, it is critical to identify bugs as early as possible and improve debug productivity.
Questa Visualizer
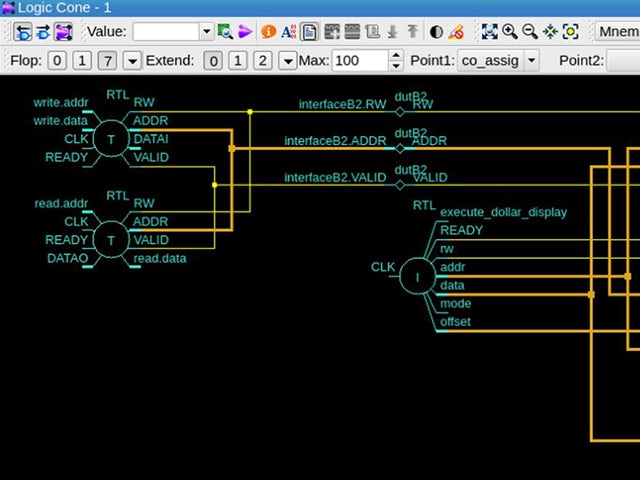
Visualizer is a high-performance, high-capacity context-aware debugger that supports a complete logic verification flow, including simulation, emulation, and prototyping and design, testbench, low-power, and assertion analysis.
Codelink
During functional simulation or emulation, advanced tracing technology automatically captures and compresses all important activity inside a design's processors and allows interactive playback of simulation and emulation runs.
UVM-Aware Debug
UVM-aware debug provides essential data on the operation of dynamic class-based testbenches in the familiar contexts of source code and waveform viewing, speeding overall debug time, even on today’s most complex SoCs and FPGAs.
Debug & Functional Coverage
High-performance debug environment for digital design and verification, with SV/UVM debug for complex testbenches.
Visualizer Debug Environment
Visualizer Debug Environment is a high performance, scalable, context-aware debug platform that supports a complete logic verification flow, including simulation, emulation, and prototyping as well as design, testbench, low-power, and assertion analysis.
